「Plugins interpolation」の版間の差分
提供: OSGeo.JP Wiki
(ページの作成: <H2> Interpolation Plugin </H2> <P> The Interplation plugin can be used to generate a TIN or IDW interpolation of a point vector layer. It is very simple to handle and provides…) |
(タグ一括置換状態で一旦保存) |
||
| 行1: | 行1: | ||
| − | + | === Interpolation Plugin === | |
| − | Interpolation Plugin | + | |
| − | + | ||
| − | |||
The Interplation plugin can be used to generate a TIN or IDW interpolation of a | The Interplation plugin can be used to generate a TIN or IDW interpolation of a | ||
point vector layer. It is very simple to handle and provides an intiuitive graphical | point vector layer. It is very simple to handle and provides an intiuitive graphical | ||
| − | user interface for creating interpolated raster layers (See Figure | + | user interface for creating interpolated raster layers (See Figure [[fig:interpolation_dialog]]). |
The plugin requires the following parameters to be specified before running: | The plugin requires the following parameters to be specified before running: | ||
| − | < | + | <ul> |
| + | <li>'''Input vector layer''': Specify the input point vector layer from a list of loaded point layers. | ||
| + | <li>'''Interpolation attribute''': Select attribute column to be used for interpolation or | ||
| + | enable the {{Template:CheckBox|Use Z-Coordinate}} checkbox to use the layers stored Z values. | ||
| + | <li>'''Interpolation Method''': Select interpolation method. This can be either {{Template:SelectString|Triangulated Irregular | ||
| + | Network (TIN)|...}} or {{Template:SelectString|Inverse Distance Weighted (IDW)|...}}. | ||
| + | <li>'''Number of columns/rows''': Specify the number row and colums for the output raster file. | ||
| + | <li>'''Output file''': Specify a name for the output raster file. | ||
| + | </ul> | ||
| − | < | + | <table align='center'> |
| − | < | + | <caption>'''Figure xx:''' Interpolation Plugin {{Template:Nix</caption> |
| − | + | <tr><td>}caption}<span id='fig:interpolation_dialog'></span> | |
| − | + | [[File:interpolate_dialog.png|340px]]</td></tr></table> | |
| − | + | ||
| − | < | + | |
| − | < | + | |
| − | + | ||
| − | + | ||
| − | + | ||
| − | </ | + | |
| − | + | ||
| − | + | ||
| − | </ | + | |
| − | + | ===== Using the plugin ===== | |
| − | + | <span id='interpolation_usage'></span> | |
| − | + | <ol> | |
| − | + | <li>Start QGIS and load an point vector layer (e.g., {{Template:FileName|elevp.csv}}). | |
| − | + | <li>Load the Interpolation plugin in the Plugin Manager (see Section | |
| − | + | [[sec:load_core_plugin]]) and click on the {{Template:ToolBtnTwo|interpolation|Interpolation}} | |
| − | + | ||
| − | + | ||
| − | + | ||
| − | + | ||
| − | + | ||
| − | + | ||
| − | + | ||
| − | + | ||
| − | + | ||
| − | + | ||
| − | + | ||
| − | + | ||
| − | < | + | |
| − | + | ||
| − | + | ||
| − | < | + | |
| − | < | + | |
| − | + | ||
| − | [[ | + | |
icon which appears in the QGIS toolbar menu. The Interpolation plugin dialog appears as | icon which appears in the QGIS toolbar menu. The Interpolation plugin dialog appears as | ||
| − | shown in Figure [[ | + | shown in Figure [[fig:interpolation_dialog]]. |
| − | < | + | <li>Select an input layer (e.g., {{Template:SelectString|elevp|...}}) and column (e.g. {{Template:FileName|ELEV}}) for |
| − | + | ||
interpolation. | interpolation. | ||
| − | < | + | <li>Select an interpolation method (e.g. {{Template:SelectString|Triangular interpolation|...}}), and specify |
| − | + | ||
the number of rows and columns (e.g. 3663 cols and 1964 rows (this is equivalent to a 1000 meter pixel resolution)) | the number of rows and columns (e.g. 3663 cols and 1964 rows (this is equivalent to a 1000 meter pixel resolution)) | ||
| − | as well as the raster output filename (e.g., elevation_tin). | + | as well as the raster output filename (e.g., {{Template:FileName|elevation_tin}}). |
| − | < | + | <li>Click {{Template:Button|Ok}}. |
| − | + | <li>For the current example, double click {{Template:FileName|elevation_tin}} in the layer list to open the Raster Layer Properties | |
| − | < | + | dialog and select {{Template:SelectString|Pseudocolor|...}} as Color Map in the {{Template:Tab|Symbology}} tab. Or you |
| − | + | can define a new color table as described in Section [[label_rasterprop]]. | |
| − | dialog and select Pseudocolor... as Color Map in the Symbology tab. Or you | + | </ol> |
| − | can define a new color table as described in Section [[ | + | |
| − | </ | + | |
| − | + | ||
| − | + | In Figure [[fig:interpolation_idw]] you see the IDW interpolation result with a 366 cols x 196 rows (10 km) | |
| − | In Figure [[ | + | resolution for the {{Template:FileName|elevp.csv}} data visualized using the Pseudocolor color table. The processing |
| − | resolution for the elevp.csv data visualized using the Pseudocolor color table. The processing | + | |
only takes a few minutes, and covers the northern part of Alaska. | only takes a few minutes, and covers the northern part of Alaska. | ||
| − | < | + | <table align='center'> |
| − | + | <caption>'''Figure xx:''' Interpolation of elevp data using IDW method {{Template:Nix</caption> | |
| − | + | <tr><td>}caption}<span id='fig:interpolation_idw'></span> | |
| − | < | + | [[File:interpolate_idw.png|454px]]</td></tr></table> |
| − | + | ||
| − | Interpolation of elevp data using IDW method </ | + | |
| − | < | + | |
| − | < | + | |
| − | </ | + | |
| − | + | ||
| − | + | ||
| − | + | ||
| − | </ | + | |
| − | + | ||
| − | + | ||
| − | + | ||
| − | + | ||
2009年10月5日 (月) 22:35時点における版
Interpolation Plugin
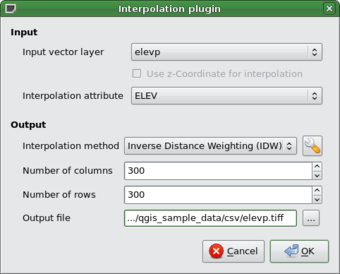
The Interplation plugin can be used to generate a TIN or IDW interpolation of a point vector layer. It is very simple to handle and provides an intiuitive graphical user interface for creating interpolated raster layers (See Figure fig:interpolation_dialog). The plugin requires the following parameters to be specified before running:
- Input vector layer: Specify the input point vector layer from a list of loaded point layers.
- Interpolation attribute: Select attribute column to be used for interpolation or
enable the
 Use Z-Coordinate checkbox to use the layers stored Z values.
- Interpolation Method: Select interpolation method. This can be either Triangulated Irregular
Network (TIN) ...
 or Inverse Distance Weighted (IDW) ...
  .
.
- Number of columns/rows: Specify the number row and colums for the output raster file.
- Output file: Specify a name for the output raster file.
}caption}
 |
Using the plugin
- Start QGIS and load an point vector layer (e.g., elevp.csv).
- Load the Interpolation plugin in the Plugin Manager (see Section
sec:load_core_plugin) and click on the
 Interpolation
icon which appears in the QGIS toolbar menu. The Interpolation plugin dialog appears as
shown in Figure fig:interpolation_dialog.
- Select an input layer (e.g., elevp ...
 ) and column (e.g. ELEV) for
interpolation.
- Select an interpolation method (e.g. Triangular interpolation ...
 ), and specify
the number of rows and columns (e.g. 3663 cols and 1964 rows (this is equivalent to a 1000 meter pixel resolution))
as well as the raster output filename (e.g., elevation_tin).
- Click Ok.
- For the current example, double click elevation_tin in the layer list to open the Raster Layer Properties
dialog and select Pseudocolor ...
 as Color Map in the Symbology tab. Or you
can define a new color table as described in Section label_rasterprop.
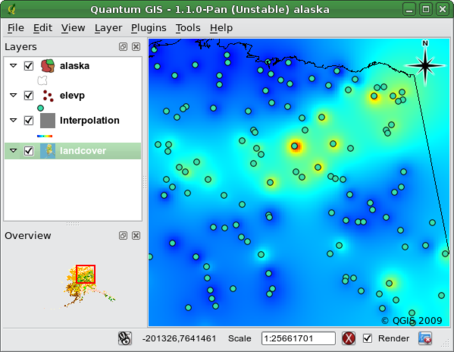
In Figure fig:interpolation_idw you see the IDW interpolation result with a 366 cols x 196 rows (10 km) resolution for the elevp.csv data visualized using the Pseudocolor color table. The processing only takes a few minutes, and covers the northern part of Alaska.
}caption}
 |